EN
 FR
 DE
 IT
 PT
 ES


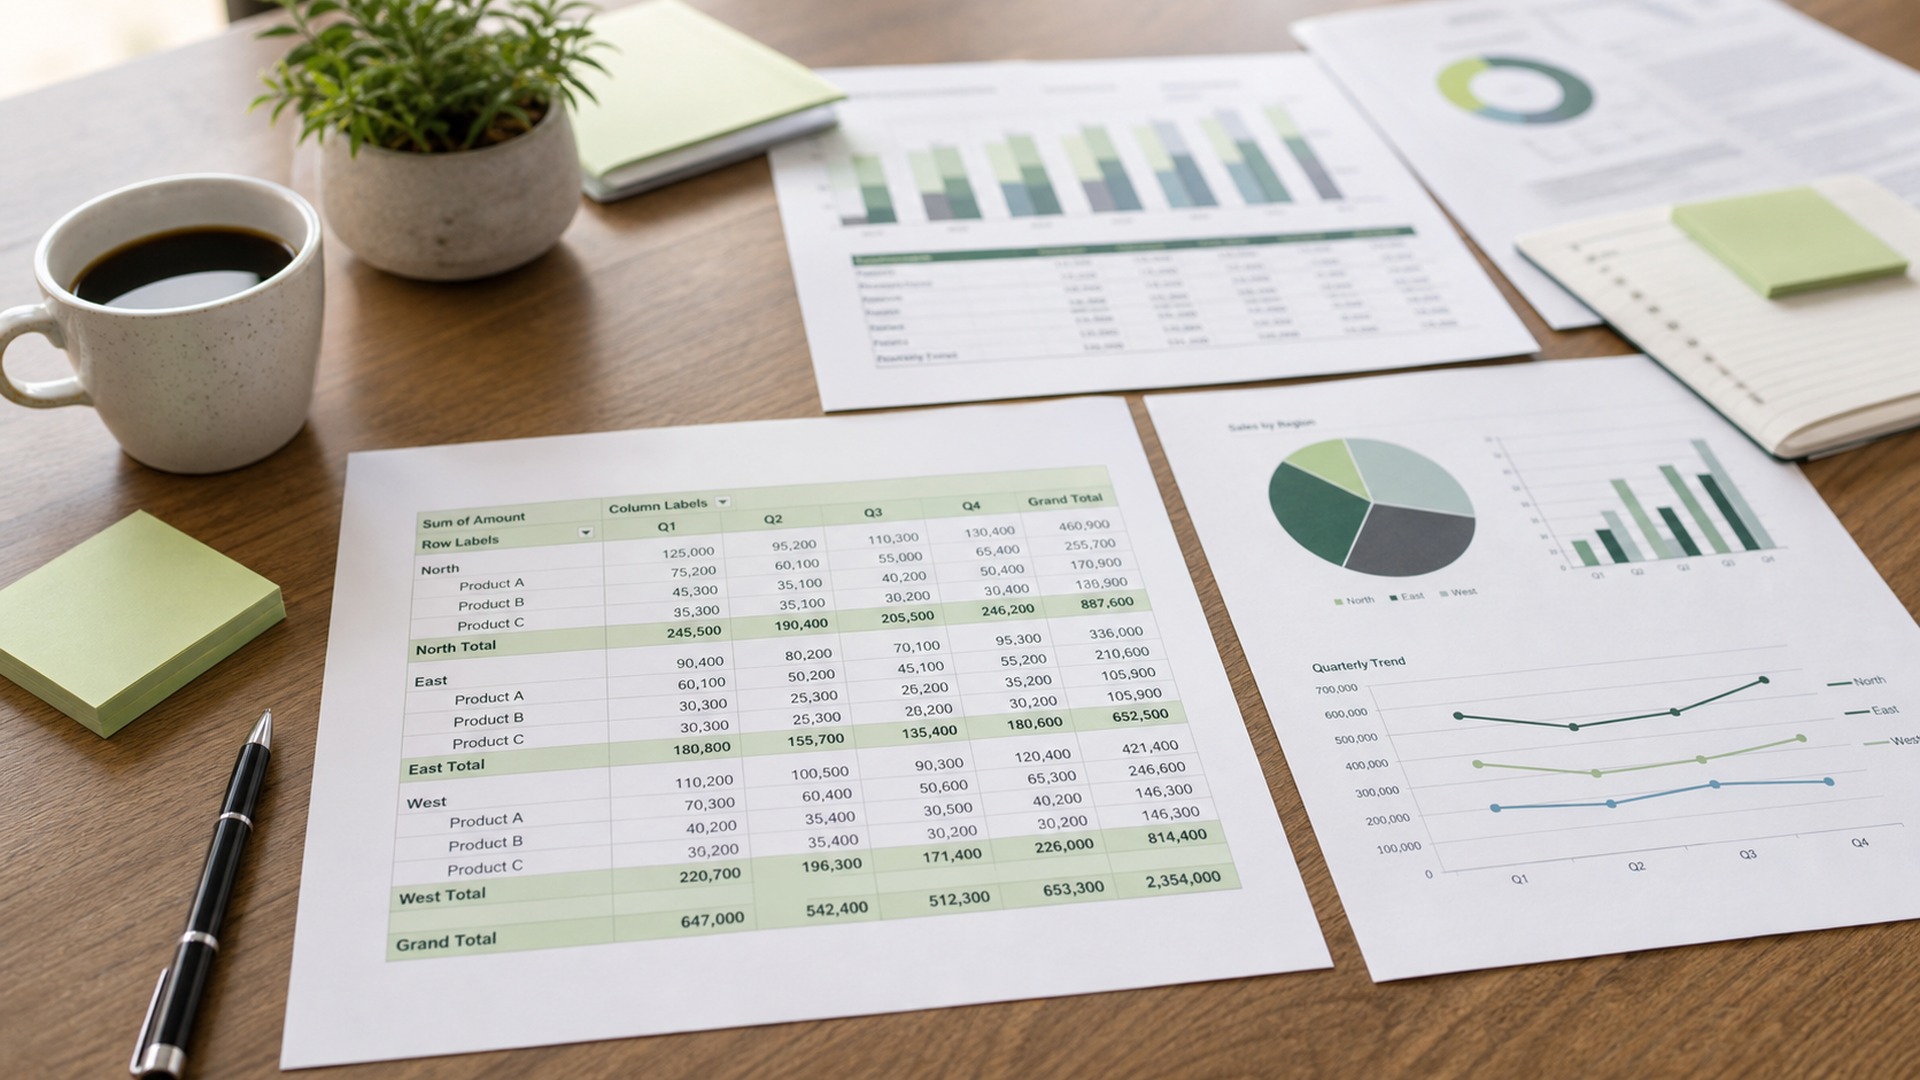
Excel pivot tables are one of Excel’s most useful features because they let you analyze thousands of rows in a few clicks. This guide moves from beginner concepts to advanced reporting: source data, fields, filters, grouping, calculations, charts and clean presentation.
Contents
- What a pivot table is and when to use one
- Prepare your data before building the pivot table
- How to create a pivot table step by step
- Fields, rows, columns, values and filters
- Sorting, filtering and slicers
- Grouping dates, numbers and categories
- Calculations, percentages and calculated fields
- Pivot charts and dashboards
- Power Pivot, data models and relationships
- Common mistakes and how to avoid them
- Checklist for professional reports
- Frequently asked questions
What a pivot table is and when to use one
A pivot table turns a long list into a summary that can be explored without complex formulas. Its value is not limited to totals: it lets you compare periods, customers, products and owners much faster than a manual report. In sales, inventory, expenses, attendance or support data, Excel pivot tables move the user from raw rows to business questions: what is growing, what is falling, which segment matters most and where action is needed.
Before building it, the source data determines the quality of the result. Every column needs a unique header, every row should represent one record and merged cells should stay outside the range. Converting the range into an Excel table is also smart because the pivot table can include new rows after refresh. That simple habit prevents a common reporting error: showing a clean report that excludes the latest data.
Prepare your data before building the pivot table
Before building it, the source data determines the quality of the result. Every column needs a unique header, every row should represent one record and merged cells should stay outside the range. Converting the range into an Excel table is also smart because the pivot table can include new rows after refresh. That simple habit prevents a common reporting error: showing a clean report that excludes the latest data.
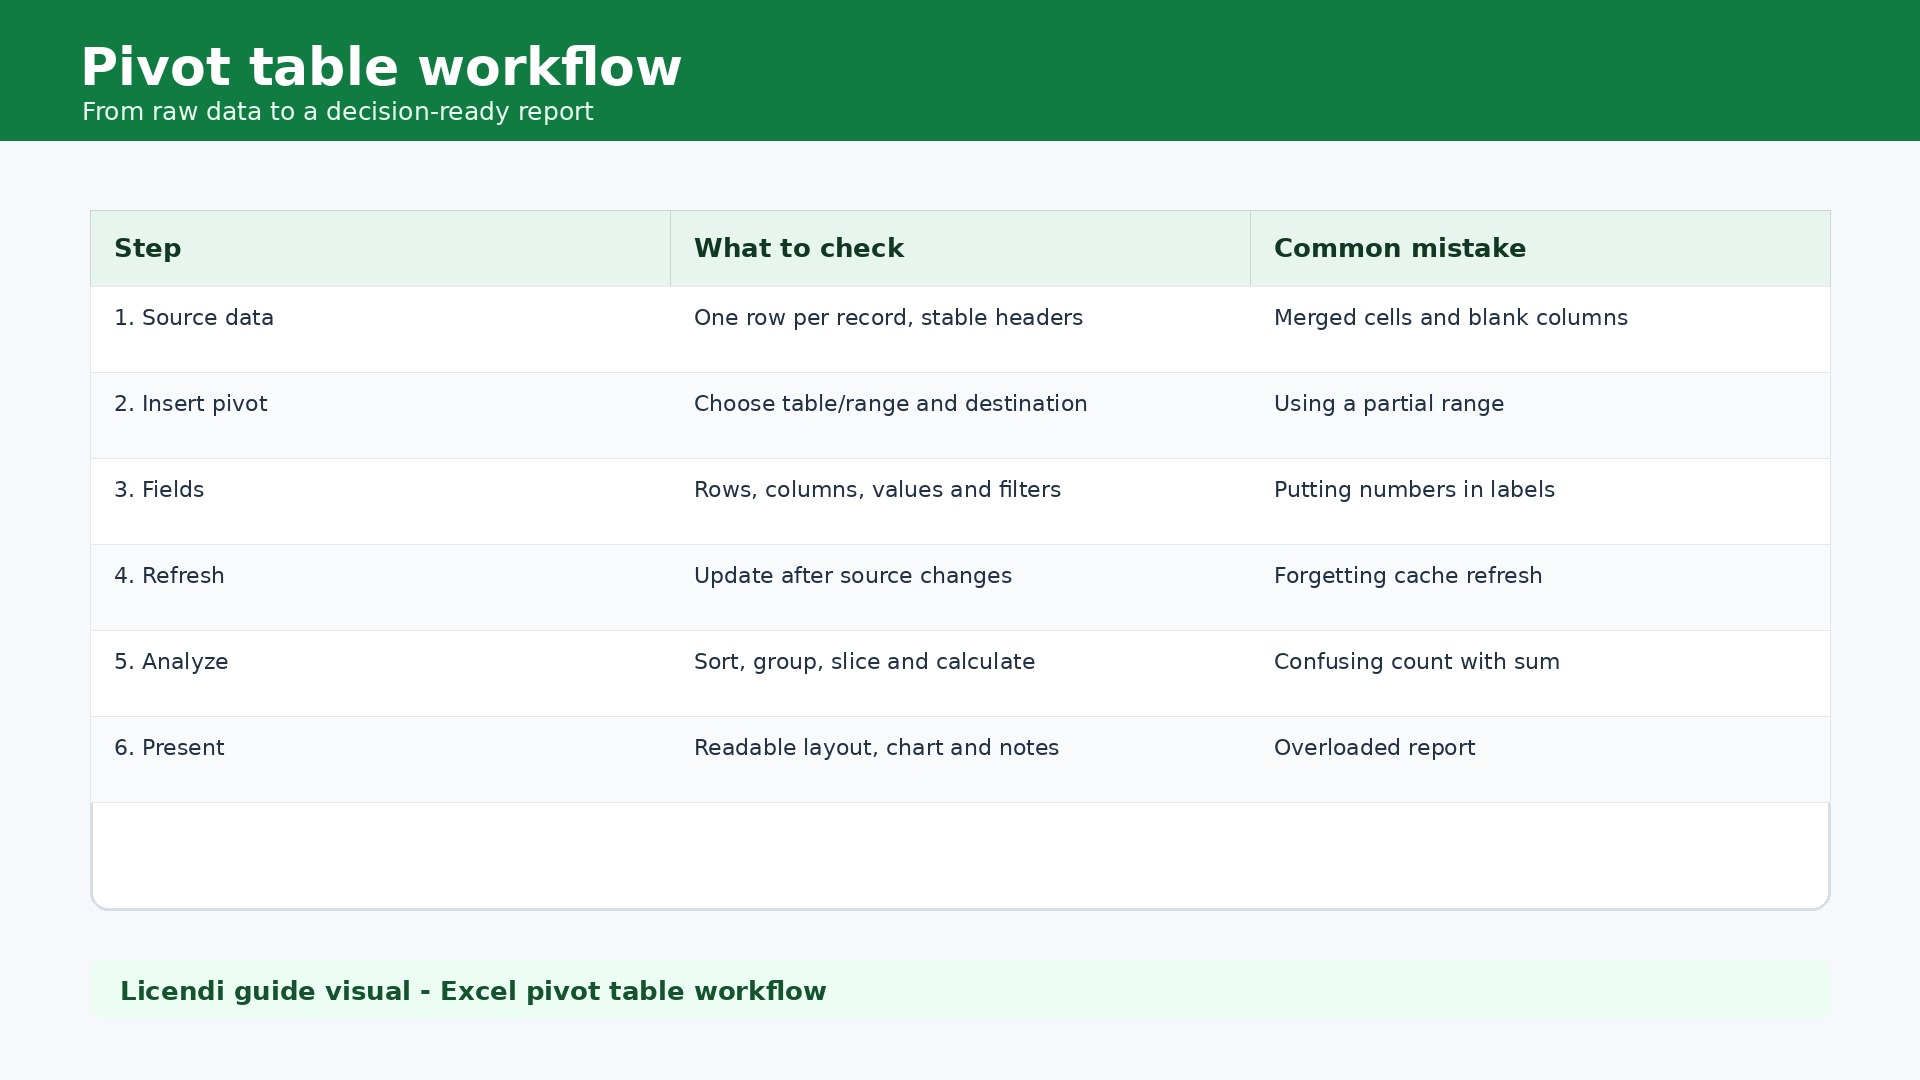
The best workflow starts with a specific question. Examples include sales by month and category, margin by salesperson or tickets by priority. Then fields are placed deliberately: rows for categories, columns for periods, values for metrics and filters for analysis boundaries. This structure sounds basic, but it keeps the report readable and stops users from dragging every available field into the layout.
To use these features reliably, a full Excel desktop version is recommended. At Licendi you can compare Microsoft Office licences, review Office 2024 Professional Plus or choose Office 2024 Standard.
How to create a pivot table step by step
The best workflow starts with a specific question. Examples include sales by month and category, margin by salesperson or tickets by priority. Then fields are placed deliberately: rows for categories, columns for periods, values for metrics and filters for analysis boundaries. This structure sounds basic, but it keeps the report readable and stops users from dragging every available field into the layout.
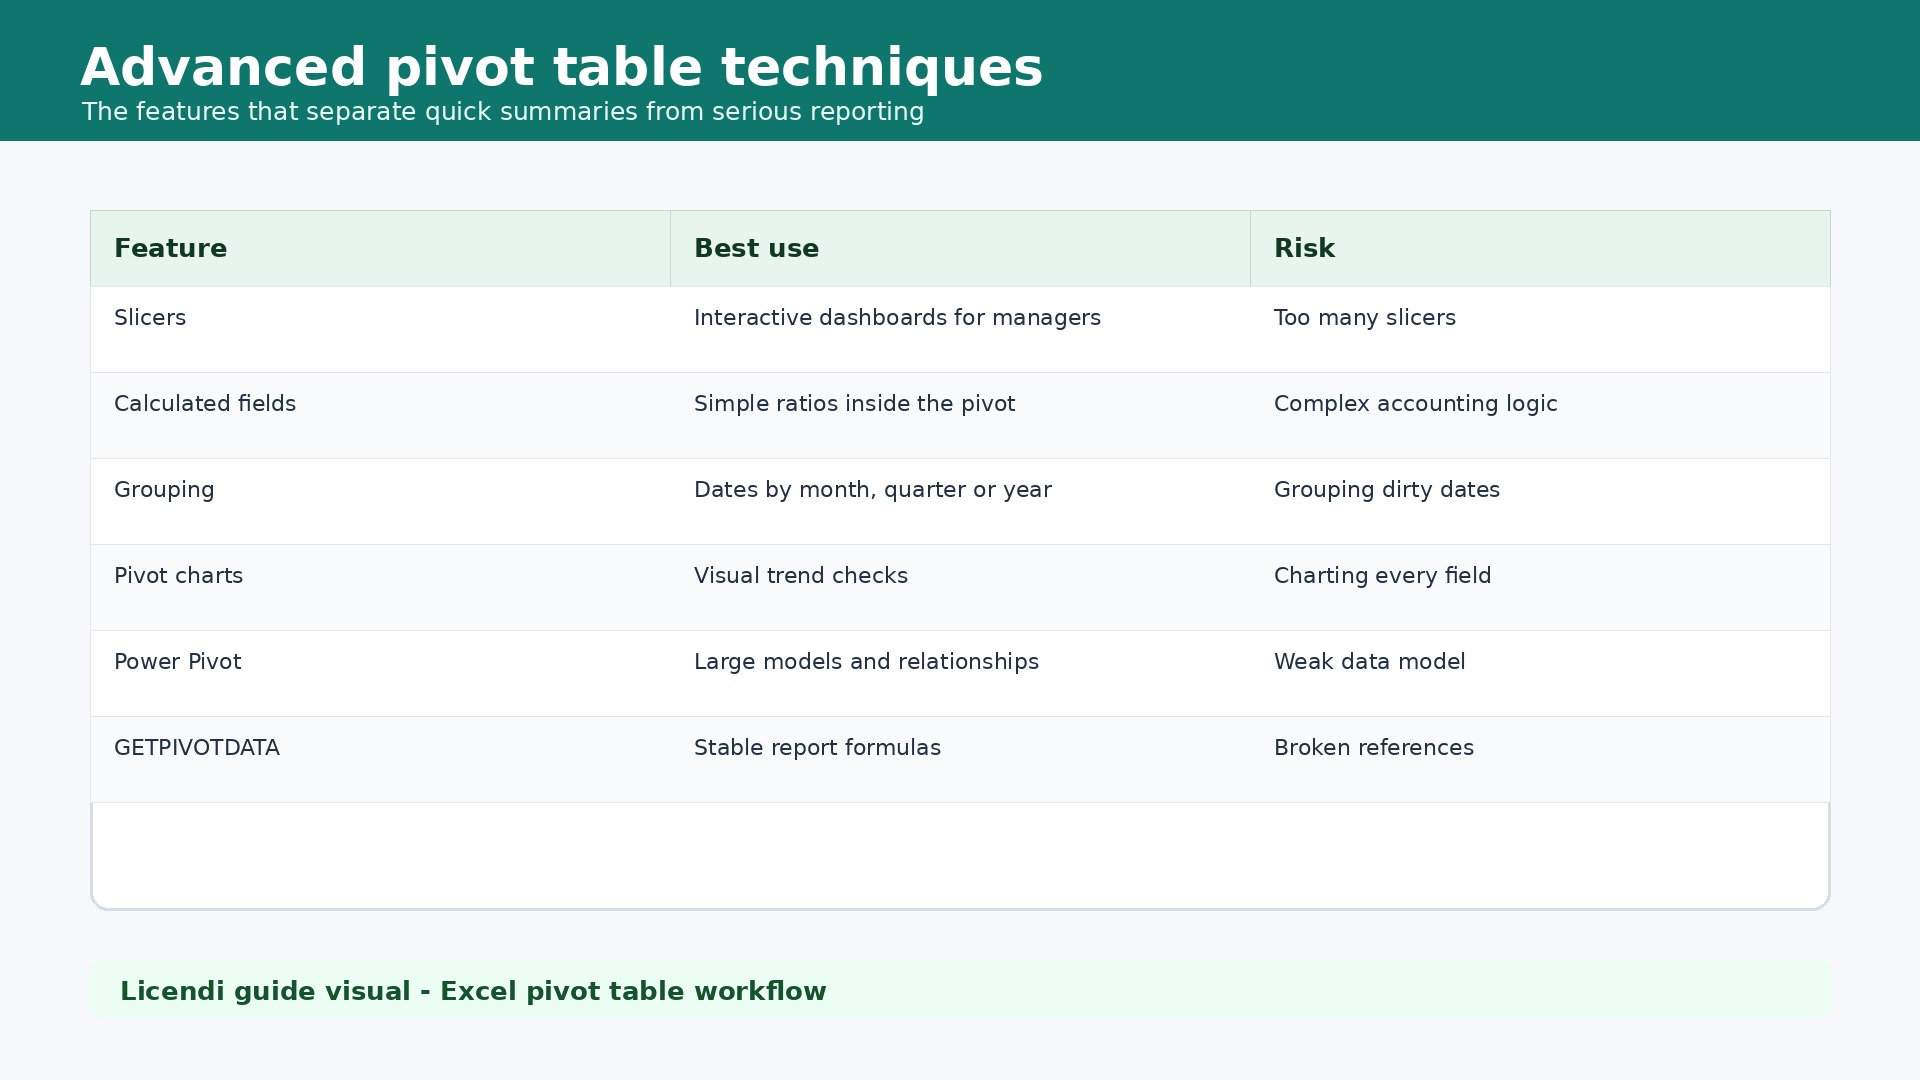
Intermediate users gain real value from slicers, timelines, grouping and values shown as percentages of totals. These features make the report usable by people who should not touch the raw data. A manager can filter a region, select a quarter and compare sales share within seconds. The pivot table becomes a control tool rather than a hidden Excel feature.
Fields, rows, columns, values and filters
Intermediate users gain real value from slicers, timelines, grouping and values shown as percentages of totals. These features make the report usable by people who should not touch the raw data. A manager can filter a region, select a quarter and compare sales share within seconds. The pivot table becomes a control tool rather than a hidden Excel feature.
Advanced work introduces calculated fields, Power Pivot, relationships and measures. Not every problem belongs inside a simple pivot table. If data comes from several sources, if there are many rows or if customers, orders and products must be related cleanly, the data model is better. The skill is choosing the right level: simple pivot table for quick analysis, Power Pivot for serious models.
Sorting, filtering and slicers
Advanced work introduces calculated fields, Power Pivot, relationships and measures. Not every problem belongs inside a simple pivot table. If data comes from several sources, if there are many rows or if customers, orders and products must be related cleanly, the data model is better. The skill is choosing the right level: simple pivot table for quick analysis, Power Pivot for serious models.
The most expensive mistake is trusting a summary without checking the source. Dates stored as text, amounts mixed with symbols, empty columns or duplicate names create strange counts and wrong totals. A good reporting routine checks row counts, refreshes the pivot, confirms the aggregation type and compares a sample against the original table.
Grouping dates, numbers and categories
The most expensive mistake is trusting a summary without checking the source. Dates stored as text, amounts mixed with symbols, empty columns or duplicate names create strange counts and wrong totals. A good reporting routine checks row counts, refreshes the pivot, confirms the aggregation type and compares a sample against the original table.
Design matters when the report is shared. Use clear labels, consistent number formats and subtotals only when they help. Do not fill the screen with every field available. A professional pivot table answers one question clearly. When the story needs context, pair the pivot with a pivot chart and a short interpretation note.
Calculations, percentages and calculated fields
Design matters when the report is shared. Use clear labels, consistent number formats and subtotals only when they help. Do not fill the screen with every field available. A professional pivot table answers one question clearly. When the story needs context, pair the pivot with a pivot chart and a short interpretation note.
A pivot table turns a long list into a summary that can be explored without complex formulas. Its value is not limited to totals: it lets you compare periods, customers, products and owners much faster than a manual report. In sales, inventory, expenses, attendance or support data, Excel pivot tables move the user from raw rows to business questions: what is growing, what is falling, which segment matters most and where action is needed.
Pivot charts and dashboards
A pivot table turns a long list into a summary that can be explored without complex formulas. Its value is not limited to totals: it lets you compare periods, customers, products and owners much faster than a manual report. In sales, inventory, expenses, attendance or support data, Excel pivot tables move the user from raw rows to business questions: what is growing, what is falling, which segment matters most and where action is needed.
Before building it, the source data determines the quality of the result. Every column needs a unique header, every row should represent one record and merged cells should stay outside the range. Converting the range into an Excel table is also smart because the pivot table can include new rows after refresh. That simple habit prevents a common reporting error: showing a clean report that excludes the latest data.
Power Pivot, data models and relationships
Before building it, the source data determines the quality of the result. Every column needs a unique header, every row should represent one record and merged cells should stay outside the range. Converting the range into an Excel table is also smart because the pivot table can include new rows after refresh. That simple habit prevents a common reporting error: showing a clean report that excludes the latest data.
The best workflow starts with a specific question. Examples include sales by month and category, margin by salesperson or tickets by priority. Then fields are placed deliberately: rows for categories, columns for periods, values for metrics and filters for analysis boundaries. This structure sounds basic, but it keeps the report readable and stops users from dragging every available field into the layout.
Microsoft maintains practical documentation for creating pivot tables and pivot charts; you can check the official Excel pivot table guide and pivot chart guide for specific steps.
Common mistakes and how to avoid them
The best workflow starts with a specific question. Examples include sales by month and category, margin by salesperson or tickets by priority. Then fields are placed deliberately: rows for categories, columns for periods, values for metrics and filters for analysis boundaries. This structure sounds basic, but it keeps the report readable and stops users from dragging every available field into the layout.
Intermediate users gain real value from slicers, timelines, grouping and values shown as percentages of totals. These features make the report usable by people who should not touch the raw data. A manager can filter a region, select a quarter and compare sales share within seconds. The pivot table becomes a control tool rather than a hidden Excel feature.
Checklist for professional reports
Intermediate users gain real value from slicers, timelines, grouping and values shown as percentages of totals. These features make the report usable by people who should not touch the raw data. A manager can filter a region, select a quarter and compare sales share within seconds. The pivot table becomes a control tool rather than a hidden Excel feature.
Advanced work introduces calculated fields, Power Pivot, relationships and measures. Not every problem belongs inside a simple pivot table. If data comes from several sources, if there are many rows or if customers, orders and products must be related cleanly, the data model is better. The skill is choosing the right level: simple pivot table for quick analysis, Power Pivot for serious models.
Practical exercise: from sales list to report
Imagine a table with date, country, salesperson, product family, units, price, discount and order status. The goal is not to create a beautiful dashboard immediately, but to understand the business question. Start with months in rows, product family in columns and total revenue as the value. Then add country as a filter and salesperson as a second level. Within minutes you can see which categories grow, which markets matter and which salespeople depend on a narrow product mix.
The next step is quality. Show the same revenue field twice: once as an absolute amount and once as percentage of grand total. Sort descending and check whether volume and contribution tell the same story. A product may sell a lot but contribute little. A region may grow because discounts are increasing. Pivot tables are useful because they expose these patterns before the meeting turns into opinion.
For presentation, do not show the source table. Create a report sheet with the pivot table, a pivot chart and two slicers such as country and product family. Add a timeline if the date field is clean. Rename fields so non-technical users see “Revenue”, “Share” and “Orders” instead of internal database names. That makes the report easier to use and much safer to share.
Common business use cases
In sales, pivot tables compare revenue by customer, product, channel, owner and period. In purchasing, they reveal suppliers with rising prices, categories with too much spend and repeated orders. In support, they summarize tickets by priority, status, agent and resolution time. In finance, they review costs by cost center, tax code, month or project. The pattern is always the same: reliable list, clear question, readable summary.
They are also useful for internal checks. A pivot table can reveal duplicate values, negative amounts, uncategorized records or transactions outside the expected period. It does not replace accounting review, but it accelerates anomaly detection. Many teams therefore use Excel as the first analytical layer before moving to Power BI, ERP reporting or heavier tools.
Frequently asked questions
What is an Excel pivot table?
It is a tool that summarizes and reorganizes data by categories, periods, filters and metrics without changing the original table.
Do I need formulas to use pivot tables?
Not at the beginning. You can sum, count, average and filter through the interface. Formulas matter later for calculated fields or Power Pivot.
Why does my pivot table not update?
Usually because it has not been refreshed or the source range does not include new rows. Using an Excel table as the source reduces that risk.
Conclusion
Mastering Excel pivot tables is not about memorizing every button. It is about a workflow: clean data, a clear question, well-placed fields, controlled refresh and readable presentation. With that foundation, beginners can grow into reliable reporting work.
View Microsoft Office licences at Licendi